Here is the strangest pair of numbers in the 2026 research. Bizzabo’s 2026 State of Events Benchmark Report found that 40% of organizers struggle to prove event ROI, down from 70% a year earlier. That is the biggest single-year improvement in measurement confidence the industry has posted in years. In the same report, the share of organizers expecting their event budget to grow fell to 40%, down from 53% in Bizzabo’s 2025 edition. Teams finally learned how to show the money, and the money got more cautious anyway.
That gap tells you how to read every other number in this piece. Finance no longer asks whether events work. It asks which events work, at what size, and whether the team can repeat the result without a bigger check. The event marketing statistics below are sorted around that question, and every figure carries its source and year so you can check it before it lands in a board deck.
Proving ROI got easier. Getting budget did not.

Start with the budget picture, because it frames everything else. Bizzabo’s 2026 survey split organizers into three groups: 40% expect their events budget to grow this year, 40% expect it to stay flat, and 20% expect a cut. A year earlier, 53% expected growth. The mood moved from expansion to discipline.
Forrester’s Q1 2026 State of B2B Events Survey, published in May 2026 from 257 B2B marketing professionals with event responsibility, reads a little warmer. Thirty-seven percent of organizations said their 2026 event budget increased, compared with 29% the year before, the first positive turn in two years. But 31% still reported cuts, the same share as 2025, even if the size of those cuts was smaller. Forrester also asked the flat-or-down group what they were changing. Sixty-nine percent were cutting the number of events, 39% were trimming agency and third-party spend, and 34% were shrinking event size. Only 9% touched ticket pricing.
Satisfaction has not recovered either. Forrester found that 48% of respondents were satisfied with their overall B2B event strategy over the prior 12 months, down from 49% in 2025 and 54% in 2024. So the measurement tools improved, the reporting improved, and the people running the programs feel slightly worse about the results.
The read for a practitioner: better measurement did its job. It exposed which events were carrying the program and which were passengers. Budgets did not shrink because events stopped working. They tightened because the data made it obvious where the waste sat. If your 2027 plan still counts total events as a success metric, you are arguing a point finance stopped caring about last year.
Is in-person still the strongest channel?
Yes, and the margin is wide. In Bizzabo’s 2026 research, 78% of organizers named in-person conferences, summits and conventions as their organization’s most impactful marketing channel. On the attendee side, 54% said they plan to attend more in-person events than last year, and 71% said in-person B2B conferences are the most effective way to learn about new products or services.
Splash’s 2025 Outlook on Events report, which surveyed 1,058 U.S. marketers between January 15 and February 18, 2025 at a 3% margin of error, found that in-person events took a clear lead in ROI during 2024. Eighty-eight percent of marketers said events helped their team generate a steady flow of revenue. Splash’s 2024 edition, built on 1,255 U.S. and U.K. marketers, found 77% calling events their most effective marketing channel in 2023 and 84% saying events help their company stand out from competitors.
Freeman’s End-of-Year Trends Recap, released in January 2026, put the same point in plainer language. Face-to-face remained the most trusted marketing channel through 2025, and in-person participation was “remarkably consistent” even as growth slowed from the highs of 2023 and 2024. Freeman also flagged a headwind worth watching: October 2025 polling from the Global Business Travel Association showed companies were still cautious about increasing travel volume.
Put those event marketing statistics together and the shape is clear. Demand for in-person is steady, not booming. Attendees still want to show up. Their employers are more careful about paying for the trip. That pushes the burden onto the organizer to make each event worth the flight, which is why the next section matters more than the headline channel rankings.
Follow the money into smaller rooms
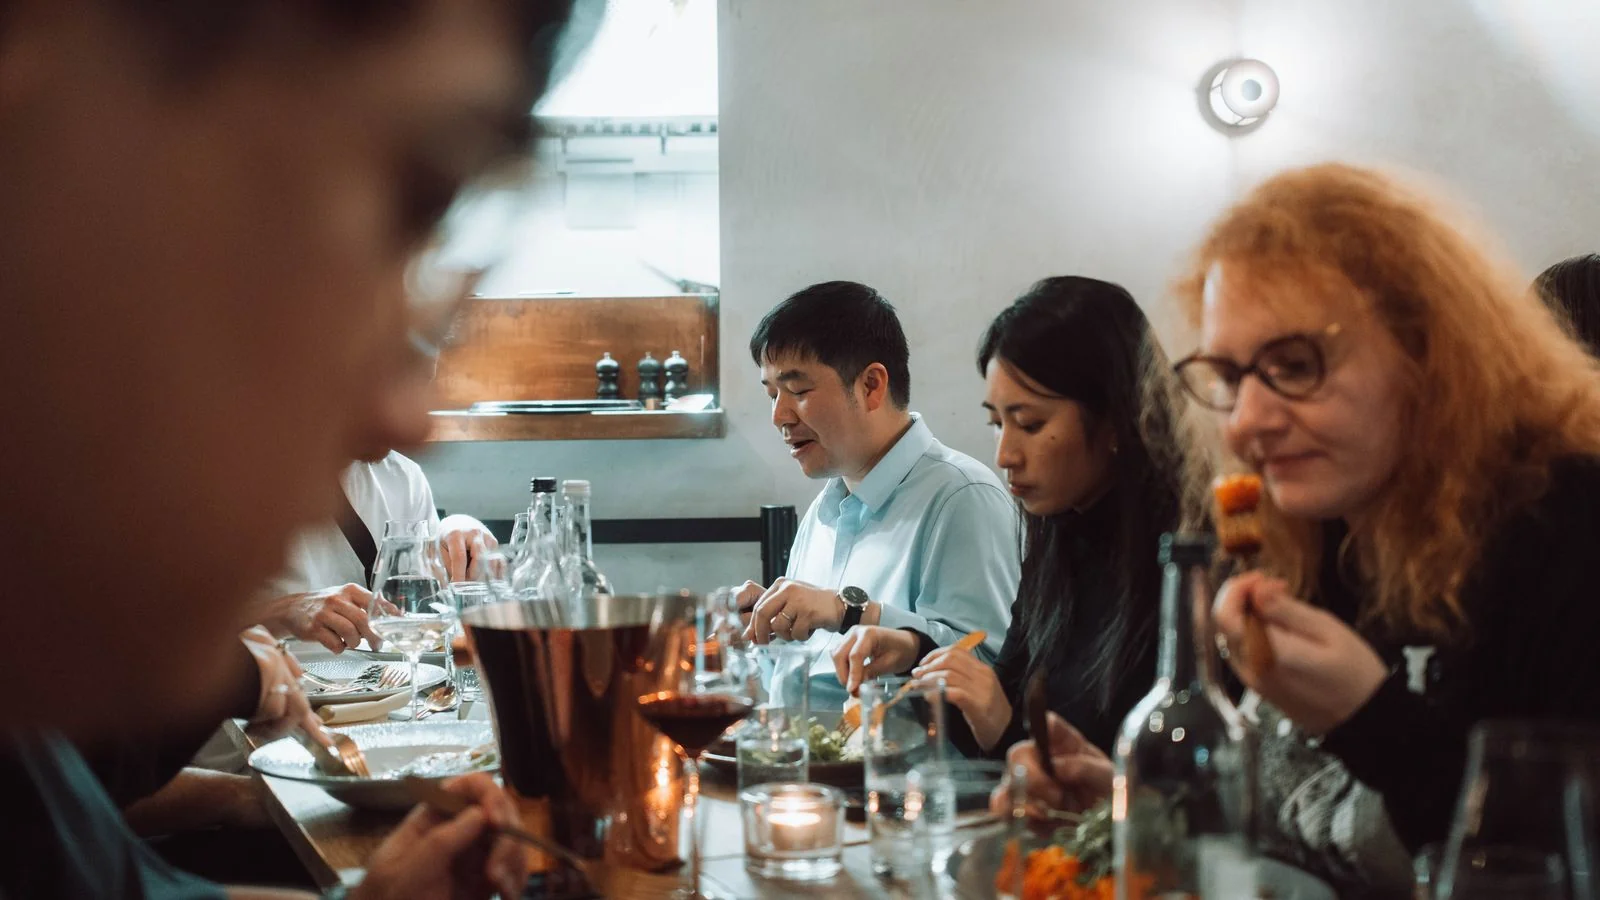
The most useful number in Forrester’s 2026 survey is the event mix. Asked what they plan to host or sponsor more of over the next 12 months, 63% of B2B marketers picked hosted intimate networking events with fewer than 20 in-person attendees. Fifty-two percent picked hosted small in-person events under 200 attendees. Forty-two percent picked webinars under an hour. Hosted large in-person events over 200 attendees came in at just 18%, flat with the year before, while hosted hybrid rose to 20% from 15%.
Read that ranking again. The format with the fewest seats is the one marketers want most. A dinner for 16 beats a conference for 2,000 on planned growth by more than three to one.
Forrester also found the budget split between owned and third-party events sits close to even, 49% hosted against 51% sponsored on average. Organizations that were satisfied with their event performance spent more on their own hosted events. The firm’s own takeaway was blunt: review your balance of owned versus third-party events.
Bizzabo’s platform data points the same direction from a different angle. Across mature, multi-event organizations, 63% of events were in-person, 33% virtual and only 4% hybrid. High-performing programs ran an average of 25 events a year. That is a portfolio of repeatable, mid-sized formats, not one tentpole and a prayer.
You can see the logic play out at the biggest show in software. Dreamforce 2025 drew nearly 50,000 attendees to San Francisco on October 14 to 16, according to Salesforce, and was expected to generate $130 million for the city. Yet sponsors working that week built their own small rooms around it. Highspot’s published recap describes a leadership dinner with 15 guests and a happy hour with 50 alongside its booth. Common Room booked a downtown bar for about 120 people, according to KTVU’s coverage on October 14, 2025. The tentpole supplies the crowd. The small room supplies the conversation that turns into a deal.
The attendance gap nobody budgets for
Here is the number that should change your venue contracts. Bizzabo’s 2026 platform data shows an average of 412 registrations and 269 attendees per event, an average attendance rate of 52% across events with recorded attendance. Roughly one registrant in two never walks in.
Most teams plan catering, room size, sales staffing and sponsor promises off the registration count. If the room is built for 412 and 269 arrive, the event feels thin, sponsors notice, and the cost per attendee jumps by more than half compared with the plan.
Timing makes it harder. Bizzabo’s 2025 State of Events report, based on a November 2024 survey of more than 1,500 organizers and attendees, found 59% of organizers reporting an increase in late registrations for in-person B2B conferences. Splash’s 2025 report found that 40% of marketers frequently struggled to meet registration and attendance goals. People decide late, and many of those who decide early change their minds.
There is evidence that the gap is fixable. Salesforce published a case study in March 2026 on its Dreamforce 2025 event agent, which recommended sessions to attendees based on their profiles. A/B testing showed attendees were 30% more likely to attend sessions the agent recommended than sessions they picked themselves, and Salesforce reported 70% higher close rates following session guidance. Bizzabo’s platform data shows a related pattern on registration pages: dynamic registration flows convert visitors at 24.4%, against 11.6% for static flows, with an overall visit-to-registration rate of 21.5%.
The pattern across both sources is the same. Personal relevance moves people from interest to a seat. Generic invitations fill a list that half-empties on the day.
What do attendees want in 2026?
They want to do something, and they want to meet someone who knows something. Freeman’s January 2026 recap found that 84% of attendees said connecting with subject matter experts was extremely or very important at the most valuable event they attended. Fifty-seven percent said hands-on opportunities or demonstrations were the most useful format for evaluating a product, and more than 90% said hands-on experiences made it easier to champion an event inside their company.
Forrester’s 2026 survey asked marketers what attendees want more of. Immersive and experiential activities scored 66%, structured networking 66%, workshops 65% and roundtables 63%. Keynotes trailed. The firm’s second takeaway was to prioritize interactive content over talking at attendees.
Networking is where organizers know they are falling short. Bizzabo’s 2026 research found 60% of organizers rate their networking as somewhat effective, and only 15% rate it as very effective, a sharp drop from 2025. Bizzabo’s platform data shows 47.3% of attendees take part in community features such as chat or discussion spaces, with an average of 574 messages per event. Half the audience engages. The other half waits to be introduced.
Freeman’s 2024 attendee study, based on nearly 2,100 respondents surveyed in November 2023, gives the clearest instruction. When asked what most improved their networking, 52% chose meet-ups with professionals facing similar challenges. Only 35% said after-hours events helped. Freeman’s 2026 recap made a similar point about celebrity speakers and after-hours parties drawing organizer attention while attendee behavior pointed to objective-driven sessions as the real value.
The practical move is to staff your experts like you staff your booth. Put product engineers, customer leads and executives on a schedule, publish who will be where, and make it easy for an attendee to book 15 minutes with the person who can answer their question.
Treat revenue statistics with care
Event revenue numbers are where vendor research gets loud, so read the methodology before you repeat them. Splash’s 2025 report found that 88% of marketers said events generated a steady flow of revenue and that 76% hit their revenue goals every quarter in 2024. Among teams using what Splash calls event-led growth, 94% reported steady revenue, against 77% overall. Thirty-one percent of marketers reported a 20-day decrease in closing time when prospects attended events.
Those are self-reported figures from marketers whose jobs depend on events, collected by a company that sells event software. They are useful as direction, not as proof. Splash’s own 2024 edition showed the weakness underneath: over half of marketers said they did not track opportunities created to measure event effectiveness, and 20% said they could not directly attribute their events to company revenue.
Forrester’s 2026 numbers give the more sober view. Asked how they measure events, 44% said they measure impact through ROI, return on objectives or return on experience. Thirty percent said they use a wide range of metrics but struggle to show impact. Twenty-one percent still rely on activity metrics such as attendee counts and booth scans, and 4% do not measure at all. The top use of event data was driving sales follow-up, at 79%, while only 36% used it to personalize the attendee experience during the event.
Forrester also asked what events are for. Generating net-new leads led at 73%, expanding customer relationships followed at 63%, then brand awareness at 48% and accelerating deals at 46%. Retention and advocacy came last at 19%. That last figure is worth a pause, since the customers already in the room are usually the cheapest pipeline you will ever touch.
When you cite event marketing statistics on revenue, cite the survey, the sample size and who paid for it. A CFO who has read one vendor report will respect the footnote.
AI moved fast, data quality did not
Expectations for AI in events rose faster than any other trend this year. Bizzabo’s 2026 research found 95% of organizers expect their organization’s use of AI in events to increase, and 35% expect a significant increase.
Actual use is narrower than the expectation. Forrester’s 2026 survey found that creating event content was the only AI use case above 50% adoption, at 64% of respondents already doing it. Post-event content repurposing, AI captioning and translation, and event data analysis followed in the 40% range. Personalized post-event follow-up and pre-event targeting, the uses closest to revenue, sat in the low 20s.
The blocker is not the software. Forrester asked what makes AI hard for events, and 63% named access to high-quality data. Sixty-two percent named measuring the value of AI, 57% named data privacy and security, and 56% named building an AI-literate team. Event technology sprawl adds to the mess. Forrester found 72% of organizations run between two and five event technology platforms, and Bizzabo found 64% of organizers plan to change their event management software vendor within the next year.
The connection back to the attendance gap is direct. The Dreamforce agent worked because Salesforce had already unified attendee profiles in its own data platform before asking AI to make recommendations. Bizzabo found 79% of organizers have their event platform integrated with CRM or marketing automation, which sounds high until you remember that integration and clean data are different things. If registration fields, badge scans and session check-ins do not land in the same record, no model can personalize anything.
Use the Half-Room Scorecard
The research points to one diagnosis. Most event programs plan for a full room and report on a full room, but live in a half room. The Half-Room Scorecard is a 12-point check built on the benchmarks above, meant to be run on every event within two weeks of the doors closing. Score each of four ratios from zero to three and add them up.
The first ratio is show rate, attendees divided by registrations. Below 40% scores zero, 40% to 51% scores one, 52% to 64% scores two, and 65% or higher scores three. Bizzabo’s 52% platform average is the line between a one and a two, so a score of two means you beat the field.
The second is registration conversion, registrations divided by unique visits to the event page. Below 12% scores zero, which is roughly where Bizzabo’s static registration flows land. Twelve to 21% scores one, 22% to 24% scores two, and 25% or higher scores three, at or above what dynamic flows achieve on Bizzabo’s platform.
The third is expert coverage, the share of attendees who had at least one booked or logged conversation with a named subject matter expert from your side. Below 10% scores zero, 10% to 24% scores one, 25% to 49% scores two, and half the room or more scores three. Freeman’s 84% finding is the reason this ratio exists. If attendees rank expert access as the core value and you cannot measure it, you are not measuring the event.
The fourth is pipeline touch, the share of attendee accounts that show a new or advanced opportunity within 30 days. Set the bands with your sales leader, since deal sizes vary, but zero should always mean no tracked opportunities at all. Forrester’s finding that 30% of teams use many metrics yet cannot show impact is the trap this ratio is built to avoid.
A total of nine or above means the format earns a repeat and possibly a bigger budget. Six to eight means keep the format and fix the lowest ratio before the next run. Five or below means the event is a candidate for the cut list, or for conversion into something smaller. Given Forrester’s mix data, the smaller version is often the better event anyway.
The scorecard does two jobs. It replaces registration counts with ratios that finance can compare across events of different sizes. And it forces your team to collect the four numbers in the same record, which is the data quality problem AI needs solved before it can help.
Where do events and earned media meet?
Events produce more content than most teams use. Bizzabo’s 2026 data shows 82% of organizers create video on demand from their events, and 53% gate at least some of it. Forrester found 64% already use AI to create event content. The raw material exists. What usually goes missing is distribution beyond the attendee list.
That matters more now because buyers increasingly ask AI assistants and answer engines who leads a category before they ever see an invitation. A keynote stat, a customer panel or a proprietary survey released at an event can become the citation those engines repeat, but only if it gets published, picked up by trade press and attached to your brand in sources the models read. A session recording behind a registration wall does none of that.
The teams getting the most from their events in 2026 treat the agenda as an editorial calendar. They pick the one finding worth announcing, give it to a reporter under embargo, publish the data on an open page, and let the event recordings serve as supporting evidence. If you want a quick read on whether your brand already shows up when buyers ask AI tools about your category, Instant Press runs a free AEO rating that checks exactly that.
Pull the 2026 numbers together and the instruction is consistent. Hold fewer, smaller, better-staffed events, measure them on ratios instead of headcounts, and make sure the best thing said in the room reaches the people who were not in it.
The programs that win 2027 budgets will be the ones that can show finance a half room scoring like a full one.