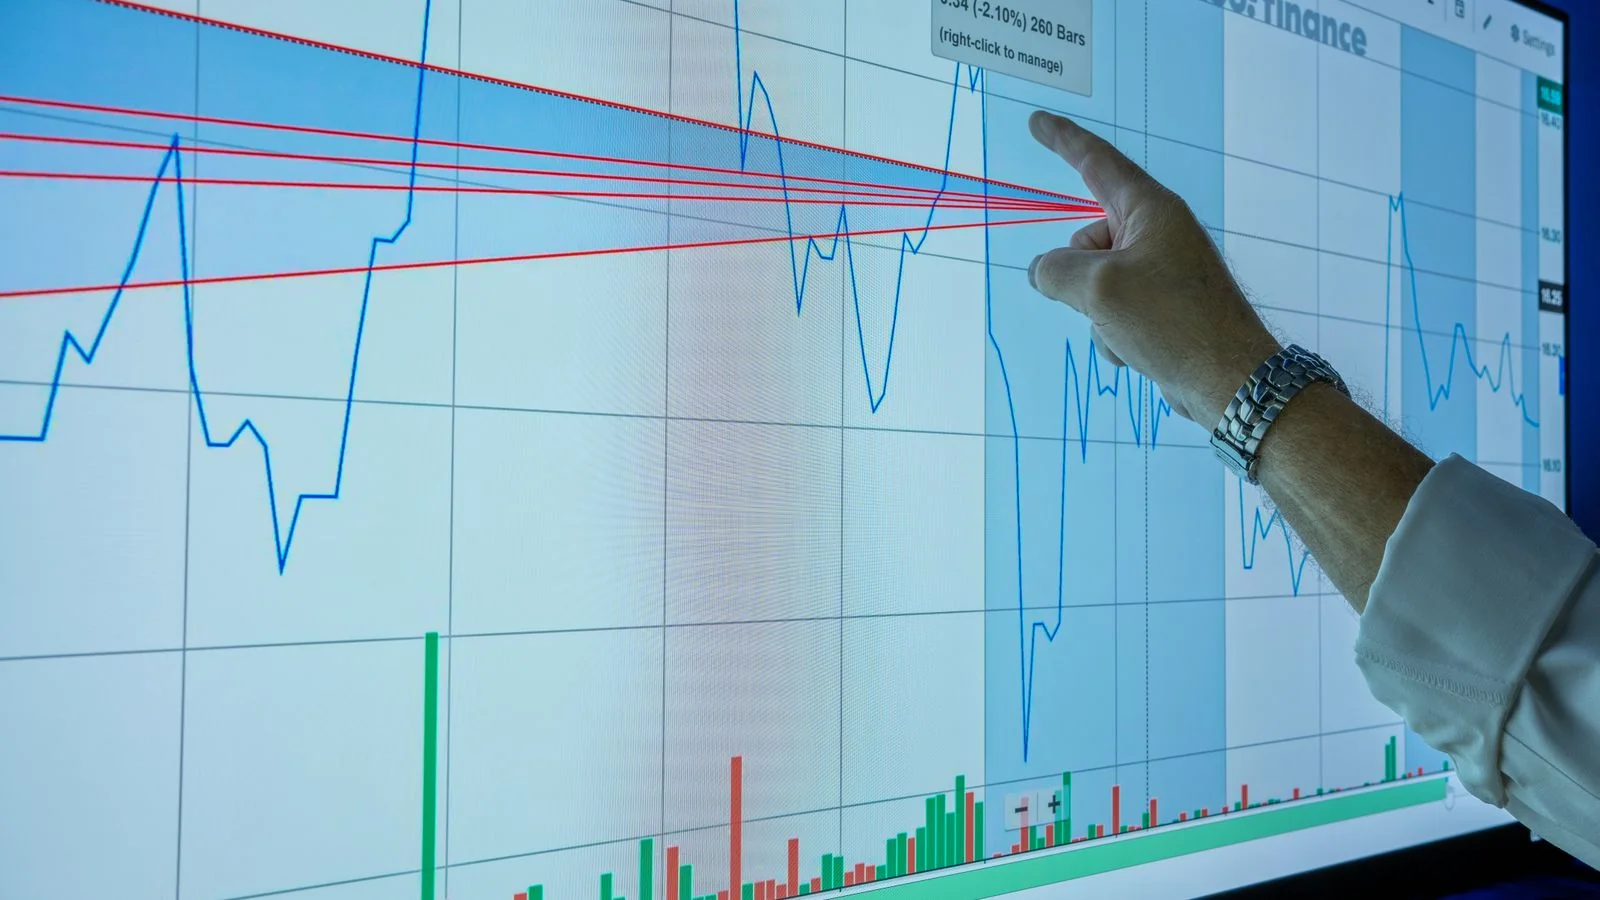
In the first four months of 2026, 68.01 percent of US Google searches ended without a single click, according to SparkToro’s clickstream study with Similarweb. Two years earlier, the figure was 60.45 percent. SparkToro called it the fastest acceleration of zero-click search in a decade, and it pinned much of the change on AI Overviews.
That one number frames every other figure on this page, and it is why organic vs paid search statistics now read so differently from even two years ago. Organic search still drives more traffic than ads for most websites, and paid search still gets more expensive every year. But the pool of clicks both channels compete for is shrinking. Below are 25 organic vs paid search statistics for 2026, grouped by what they tell you, each with its source and date. At the end, I show a simple calculation that turns these numbers into a decision about how much organic traffic is worth defending.
Where Google’s clicks go now
1. 68.01 percent of US Google searches ended without a click from January to April 2026 (SparkToro and Similarweb, June 2026).
2. The same measure stood at 60.45 percent in 2024, a rise of about 7.5 percentage points in two years (SparkToro, 2026).
3. AI Overviews now appear on more than 20 percent of all Google searches, according to SparkToro’s 2026 analysis.
4. In 2024, for every 1,000 US Google searches, 360 clicks went to the open web, meaning a site that is neither owned by Google nor a Google ad. In the EU, the figure was 374 (SparkToro and Datos, 2024).
5. Almost 30 percent of clicks after a US Google search went to Google-owned properties such as YouTube, Maps and Images in the same 2024 study.
6. In March 2025, 40.3 percent of US Google searchers clicked an organic result, down from 44.2 percent a year earlier, according to Similarweb data reported by Search Engine Land.
7. In that same dataset, 14.3 percent of US searches led to a click on a Google-owned property, up from 12.1 percent (Similarweb, 2025).
A note on definitions before you quote any of these. SparkToro counts a search as zero-click if no click follows within the session. Similarweb’s 2025 report used a narrower definition and found 27.2 percent of US searches ended without a click. Both are valid. They measure different things, so never compare a number from one study with a number from another as if they were a trend.
Organic click-through rates in the AI Overview era
8. An AI Overview correlated with a 58 percent lower average click-through rate for the top-ranking page in December 2025, based on 300,000 keywords (Ahrefs, February 2026).
9. Ahrefs’ earlier study, using March 2025 data, put the drop at 34.5 percent. The effect nearly doubled in nine months.
10. For informational keywords without an AI Overview, Ahrefs found position-one CTR fell from 7.6 percent in December 2023 to 3.9 percent in December 2025. For keywords that gained an AI Overview, it fell from 7.3 percent to 1.6 percent.
11. The drop shrinks further down the page. Ahrefs measured a 50.8 percent CTR reduction at position two, 46.4 percent at position three and 19.4 percent at position ten.
12. Pew Research Center tracked 900 US adults across 68,879 searches in March 2025. Users clicked a traditional result on 8 percent of visits that showed an AI summary, against 15 percent of visits without one.
13. In the same Pew study, users clicked a link inside the AI summary itself on just 1 percent of visits, and ended their browsing session on 26 percent of pages with a summary, against 16 percent without.
14. Seer Interactive’s 2026 study, covering 53 brands, 5.47 million queries and 2.43 billion organic impressions, found organic CTR on queries without an AI Overview rose from 2.8 percent in January 2025 to 3.8 percent in February 2026. Seer’s explanation is a selection effect: AI Overviews absorb low-intent questions, leaving higher-intent searches behind.
15. On searches that showed an AI Overview but did not cite the brand, Seer found organic CTR fell 67 percent over 2025, roughly 13,000 fewer clicks for every million impressions.
16. One study pushes the other way. Semrush, using Datos clickstream data on more than 200,000 keywords, found the zero-click rate on keywords that gained an AI Overview between May and October 2025 fell from 33.75 percent to 31.53 percent (Semrush, December 2025). Google has also said total organic click volume has been relatively stable. The direction of the CTR evidence is clear, but the size of the effect depends on the query set.
What paid search costs in 2026
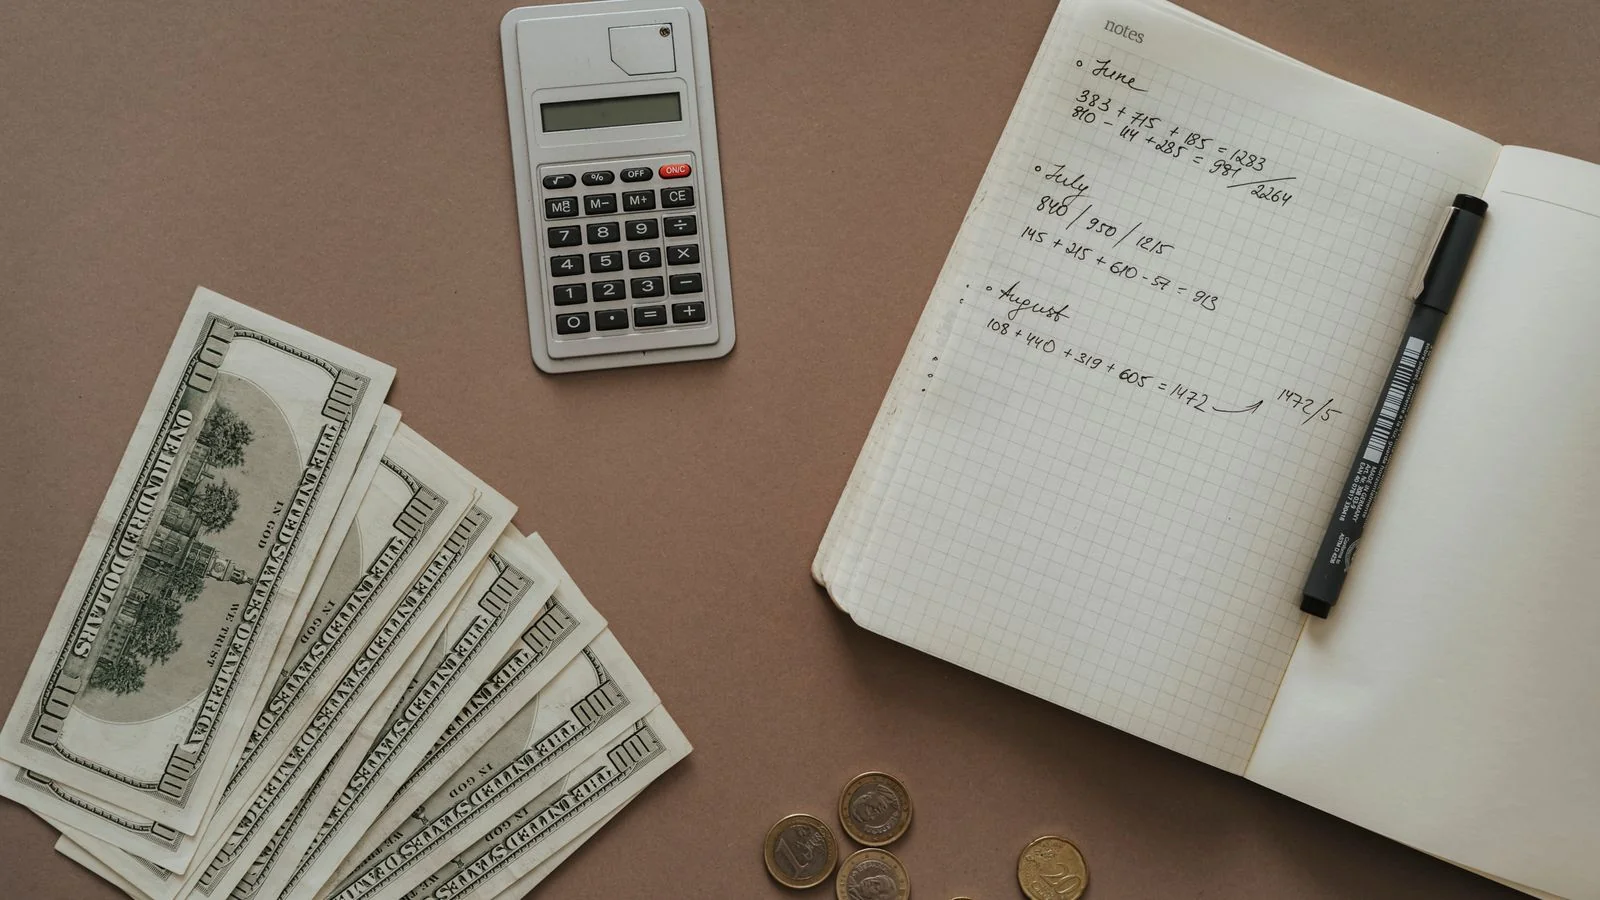
17. The average cost per click on Google search ads was 5.42 dollars in WordStream’s 2026 benchmarks, based on more than 13,000 US campaigns running from April 2025 through March 2026.
18. That compares with 5.26 dollars in WordStream’s 2025 report, which covered 16,446 campaigns from April 2024 through March 2025.
19. Cost per click rose for 87 percent of industries in the 2025 report, after rising for 86 percent the year before. Education and beauty saw increases of more than 40 percent.
20. The average search ad click-through rate was 6.64 percent in 2026, almost flat from 6.66 percent in 2025 (WordStream).
21. The average conversion rate rose to 8.18 percent in 2026, from 7.52 percent in 2025, while average cost per lead fell to 66.69 dollars from 70.11 dollars (WordStream).
That last pair is worth a second look. Clicks cost more, but they converted better, so the cost of a lead fell. One plausible reading fits the Seer selection effect: as AI answers satisfy casual questions, the people who still click ads are closer to buying. WordStream reports medians to limit the pull of outliers, so treat these as typical figures rather than targets.
Paid click-through rates feel AI Overviews too
22. Seer Interactive found paid CTR on queries without an AI Overview fell from 26 percent in January 2025 to 21.8 percent in February 2026, a decline of about 16 percent.
23. On queries that showed an AI Overview, paid CTR rose from 14.6 percent to 16.2 percent over the same period (Seer, 2026). Ads lose clicks when an answer box appears, but that loss seems to have stopped growing.
24. In Seer’s Q3 2025 data, on informational queries where an AI Overview appeared and the brand was not cited, organic CTR was 0.52 percent, down 65.2 percent year over year, and paid CTR was 4.14 percent, down 78.4 percent. When the brand was cited, organic CTR was 0.70 percent, down 49.4 percent.
25. Being cited inside the AI Overview correlated with 35 percent more organic clicks and 91 percent more paid clicks than not being cited (Seer Interactive, November 2025).
Statistic 25 may be the most important on this page for anyone choosing between channels. It suggests the AI answer is now a layer that sits on top of both organic and paid results, and the brands it names do better on both. Seer is careful to say the link is a correlation. Even so, it is the strongest public evidence that earning citations, through coverage, reviews and clear source pages, supports paid performance as well as organic.
The Click Replacement Cost
Statistics are only useful if they change a decision. The decision most teams face is how much to spend defending organic traffic versus buying clicks. I use a simple measure I call the Click Replacement Cost to frame it.
Take the monthly organic clicks a page or a section of your site earns, from Google Search Console. Multiply by the average cost per click you would pay for the same queries, from your own Google Ads account or, as a rough starting point, WordStream’s 5.42 dollar average. The result is what you would pay each month to buy that traffic instead of earning it.
A guide that earns 2,000 organic clicks a month has a Click Replacement Cost of 10,840 dollars a month at the 2026 average. If an AI Overview cuts its CTR by half, you lose about 5,420 dollars of monthly value. That figure tells you how much effort it is worth putting into getting the page cited in the overview, refreshing it, or building coverage that names it.
Run the number for your top twenty pages. Start with the pages that earn the most clicks, then add the pages that target your most expensive keywords, since those carry the highest replacement cost even at modest traffic. It turns a vague argument about SEO versus ads into a ranked list with dollar figures attached, and it shows which pages have the most to lose from AI answers. Commercial pages in expensive categories usually top the list, and they deserve the most protection.
Know the limits of the measure. An organic click and a paid click on the same query are not always worth the same, because intent, landing page and brand trust differ. Some of your organic traffic would never be bought at all, since nobody bids on obscure informational questions. Treat the Click Replacement Cost as an upper bound on value, not a precise price, and use it to compare pages with each other rather than to justify a budget line on its own.
What these organic vs paid search statistics mean for your budget
Three conclusions hold up across the studies. First, the number of clicks per search is falling for both channels, so growth now depends on capturing a larger share of a smaller pool. Second, each click costs more to buy, which raises the value of every click you still earn. Third, AI answers sit on top of everything, and being named in them correlates with better results on both sides of the page.
For most teams, that points to a mixed plan rather than a switch. Keep paid search for high-intent commercial queries, where conversion rates are rising. Keep investing in organic, but measure it by citations and qualified clicks, not raw sessions. And treat earned coverage on trusted sites as part of search strategy, because those are the sources AI answers draw on. Our zero-click search statistics and Google AI Overviews statistics go deeper on the AI side.
These organic vs paid search statistics will keep moving, and fast. Check the dates on every number before you cite it, link to the original study rather than a roundup that quotes it, and rerun your own Click Replacement Cost each quarter. The trend line for your site matters more than any industry average.